Steel sheet gong: how the parameters shape the sound

Front view 12 x 18 in, 0.79 mm stainless steel hangs from a thread through a hole drumstick strike 70% of width, 35% of height finger pushes this corner 10 mm toward the listener, holds it until the sheet settles, then lets go Top view the sheet seen from above bow of 3 mm across the width (exaggerated), bulging toward the listener push 1 m listener on the normal through the center

The setup: the sheet hangs from a thread through a hole near one corner. It is either pushed at the opposite corner by a fingertip, held until it settles, and released, or struck with a wooden drumstick. It has a slight bow, and the sound is computed 1 m in front of its center.

Each section varies one property of the simulated sheet or of the excitation while everything else stays at the simulator defaults: a 12 by 18 inch, 22 gauge (0.79 mm) stainless steel sheet hanging in portrait orientation with a 3 mm bow across its width, heard 1 m in front of its center, recorded for 4 s. The clips are computed with the simulator's default numerical settings (8 mm grid), so the 'Open in simulator' links reproduce them exactly. Click a player to hear a clip. Every clip is rendered at the simulator's default playback level (+20 dB relative to 1 Pa at full scale, with the same soft clipper), so loudness differences within and between sections are the ones the model predicts, and a clip sounds as it does in the app. The numbers under each clip are the peak pressure and sound pressure level at the listener, the RMS pressure over the clip, the spectral centroid of the sound between 0.2 and 1.2 s (a measure of brightness), and fitted 60 dB decay times of a low and a high band.

Drumstick: stick speed

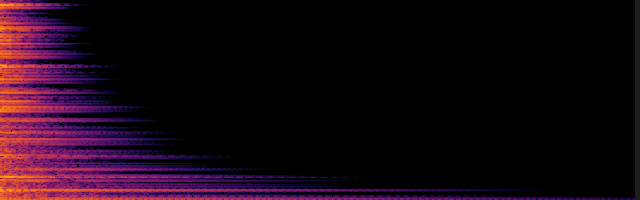
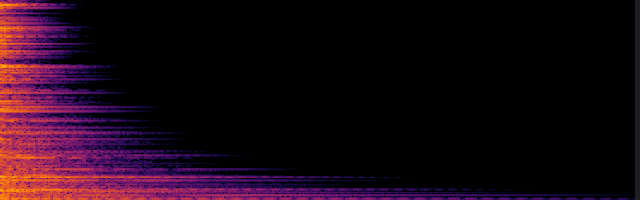
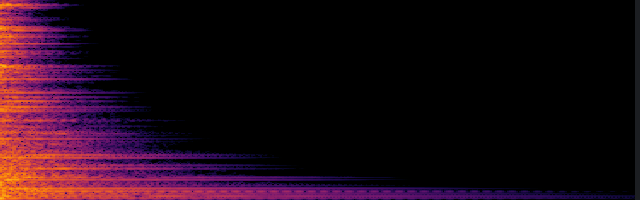
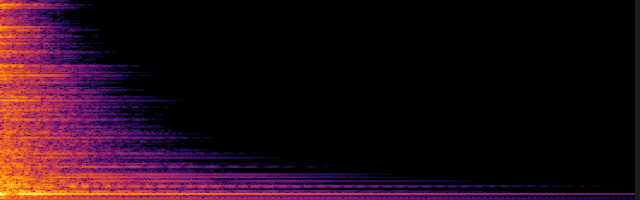
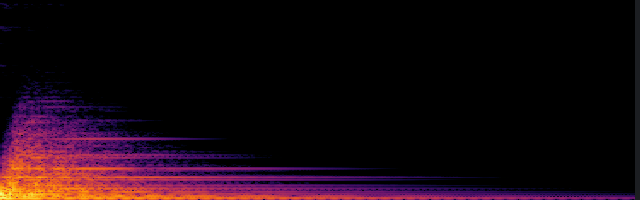
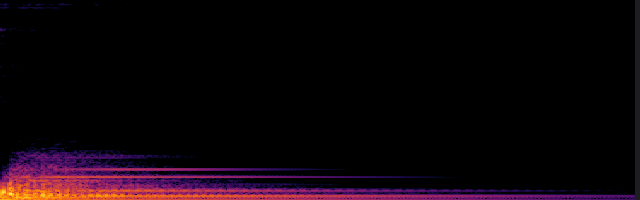
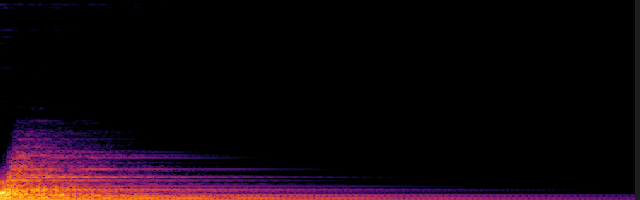
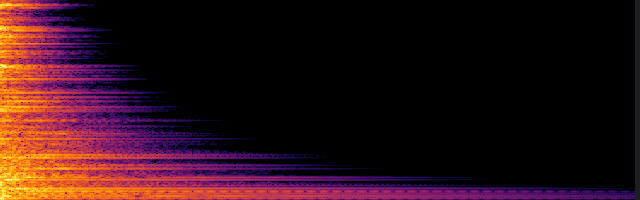
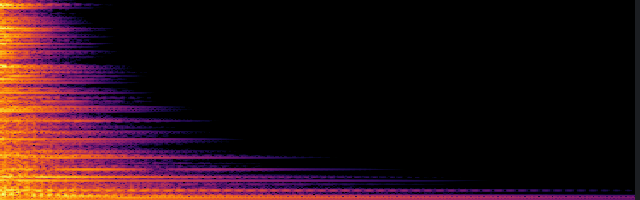
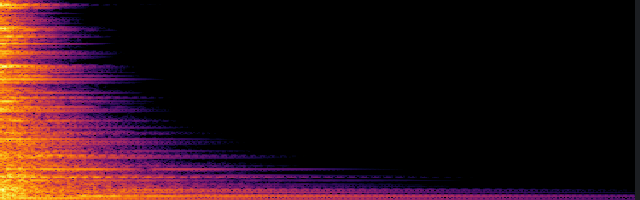
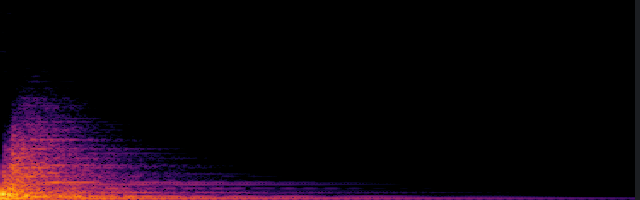
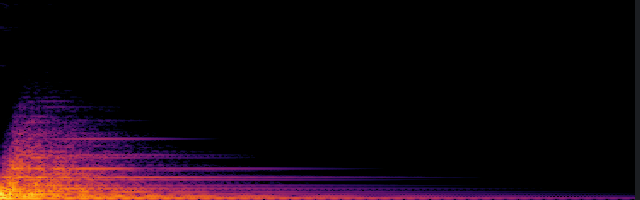
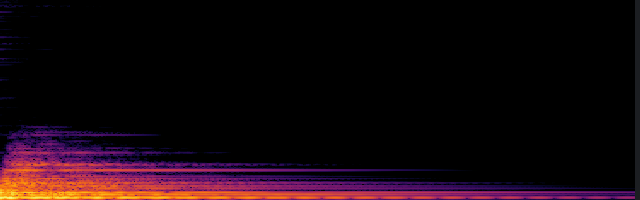
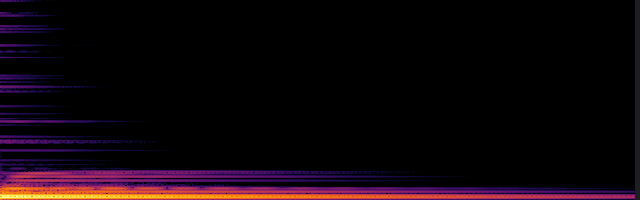
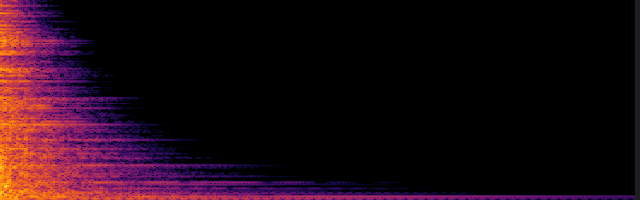
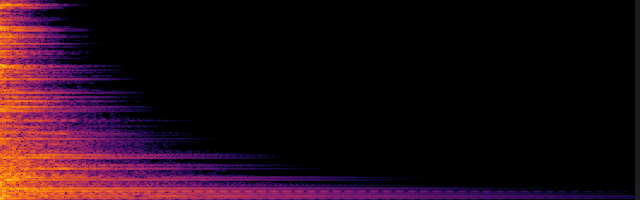
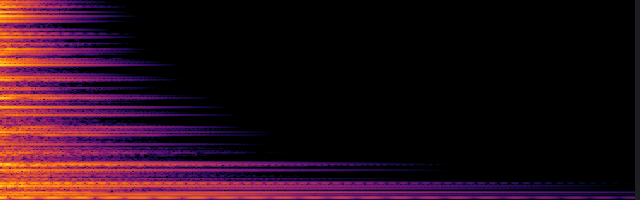
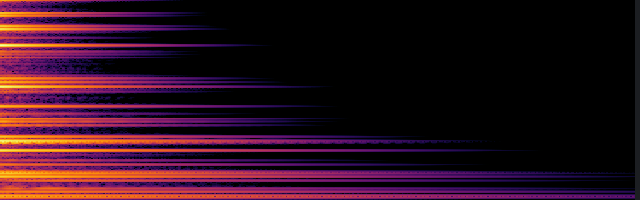
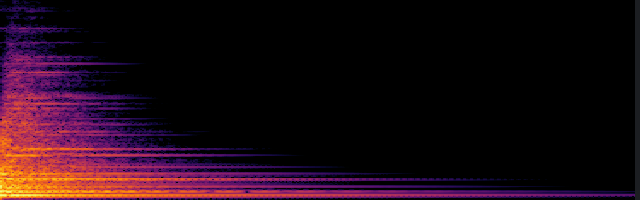
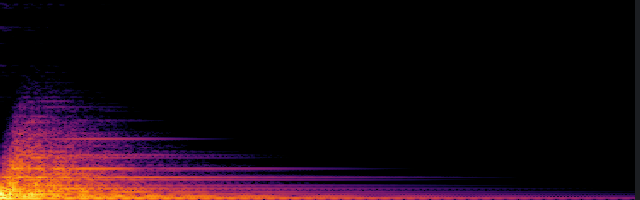
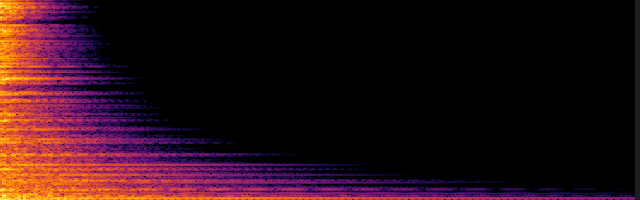
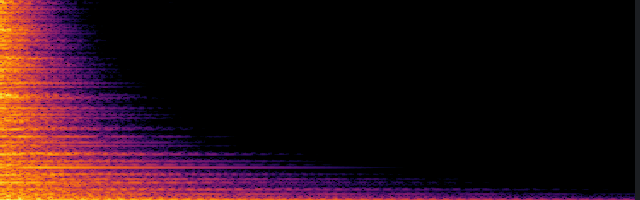
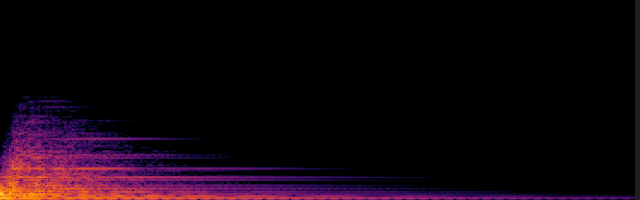
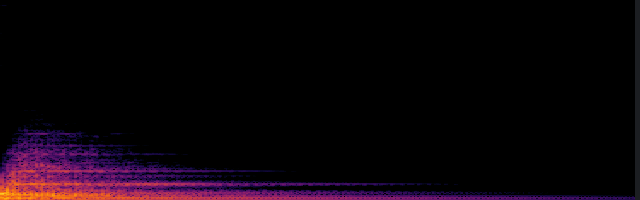
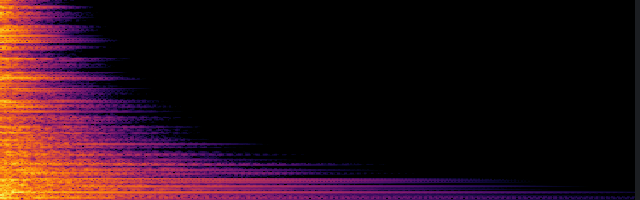
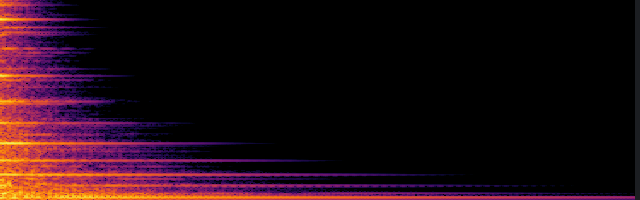
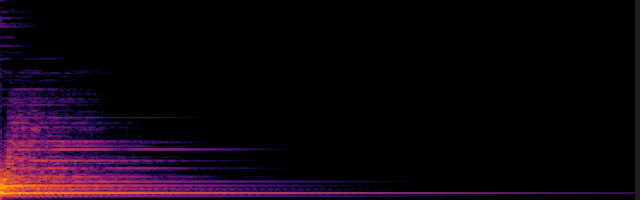
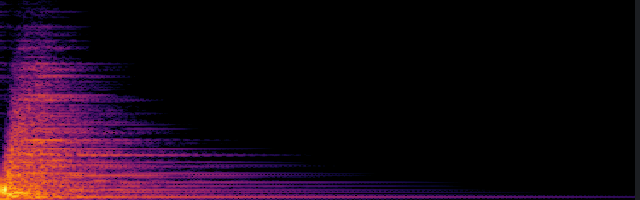
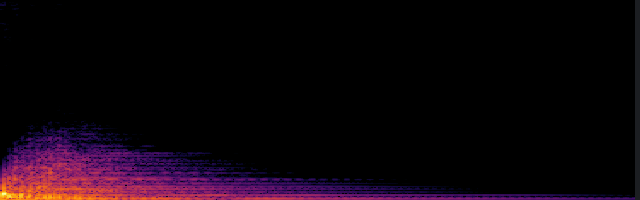
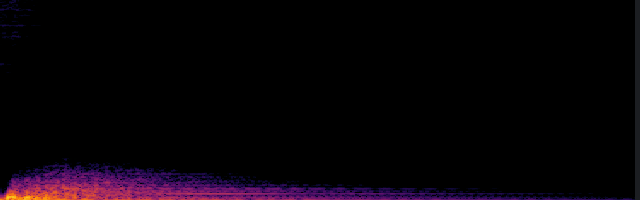
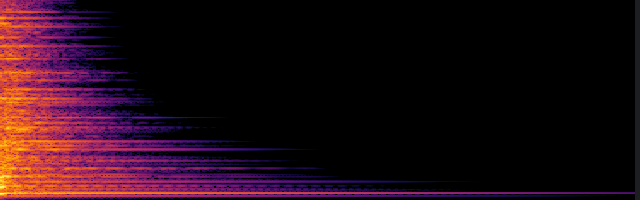
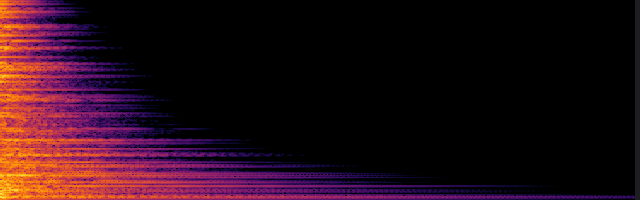
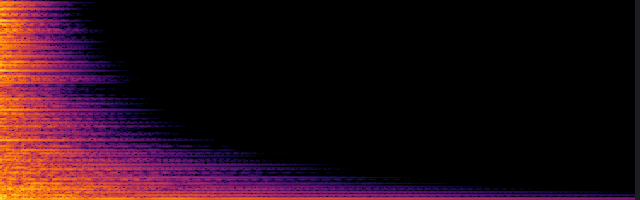
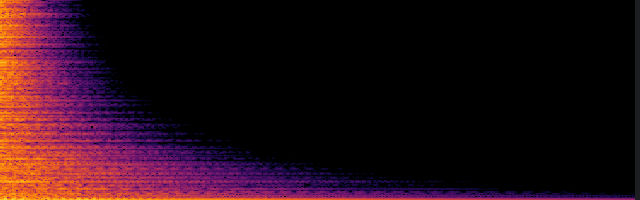
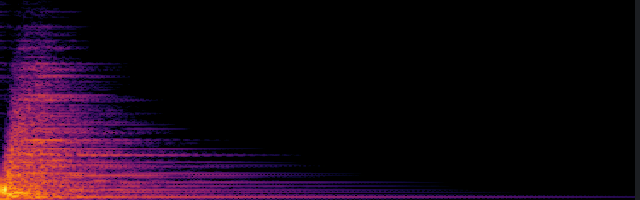
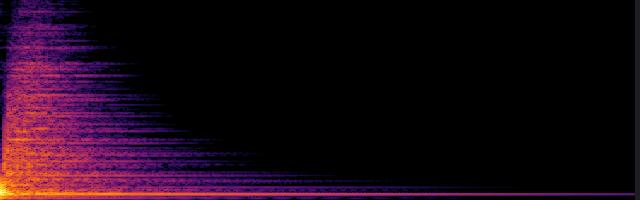
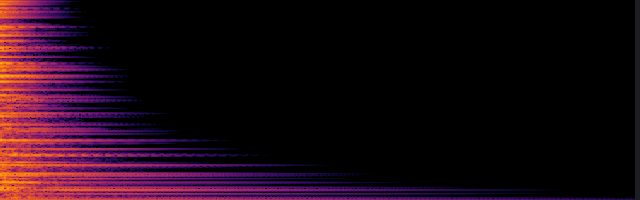
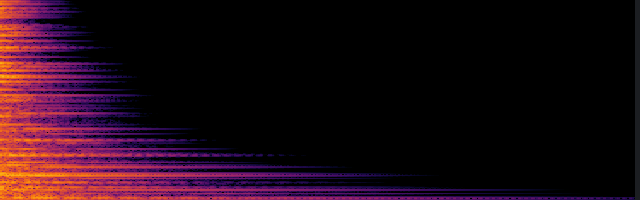
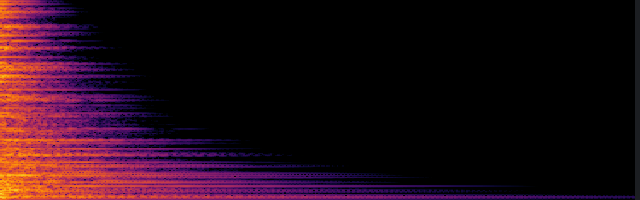
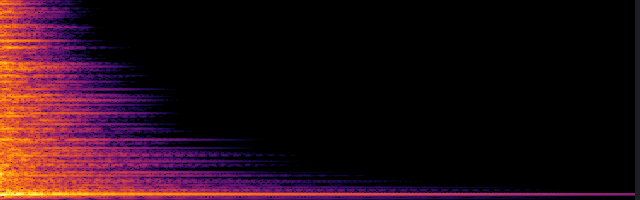
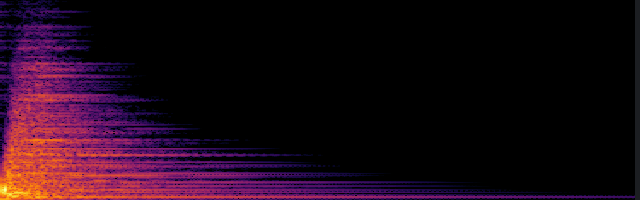
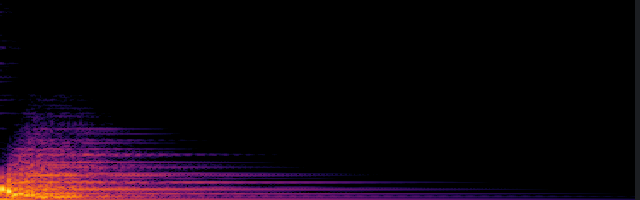
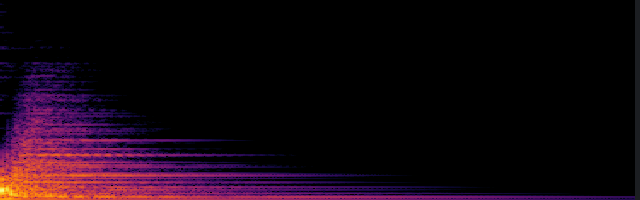
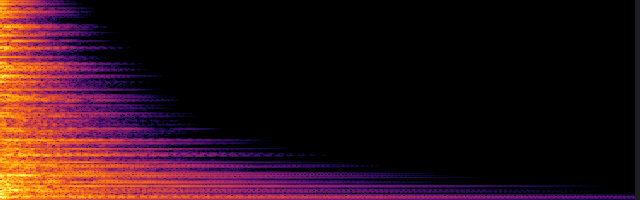
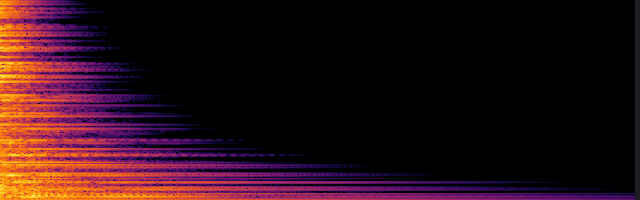
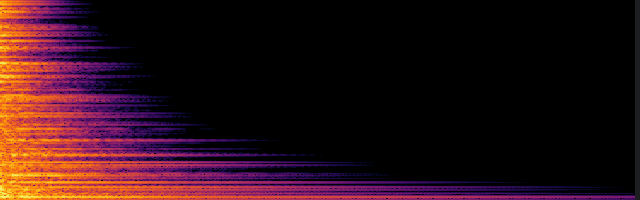
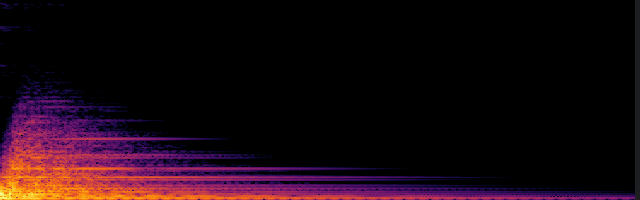
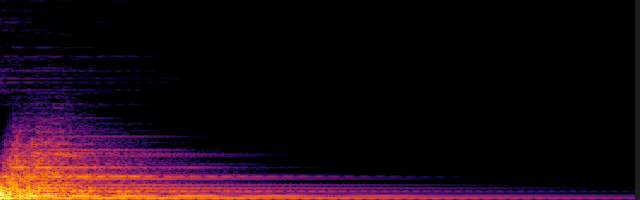
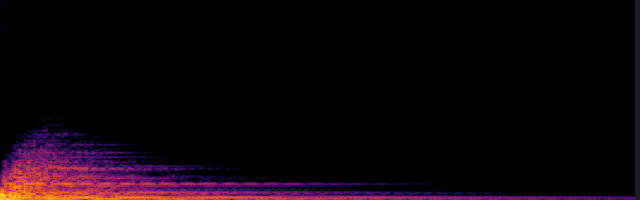
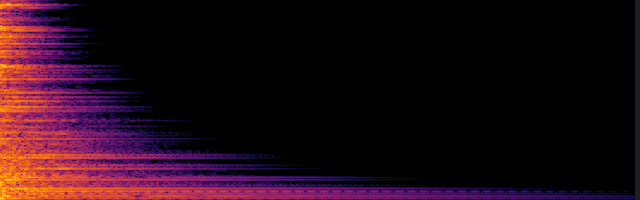
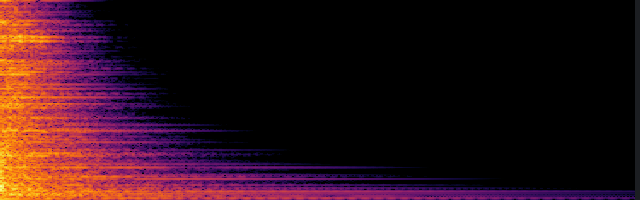
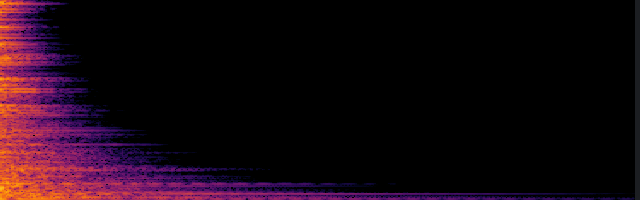
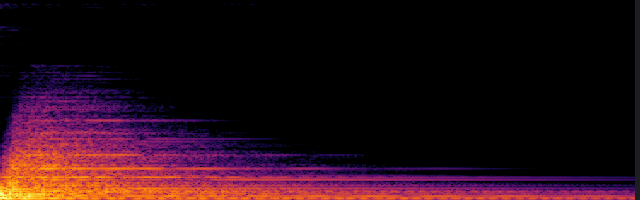
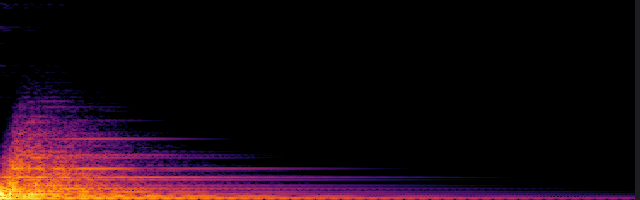
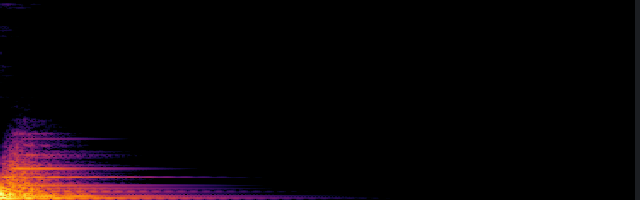
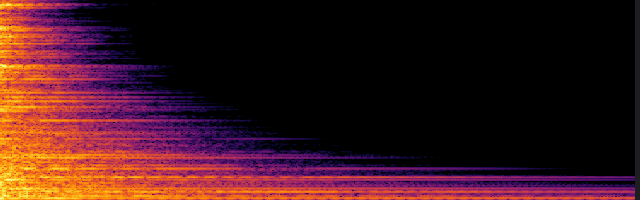
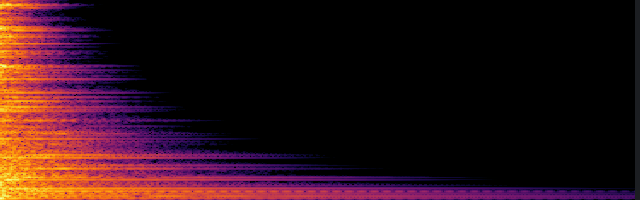
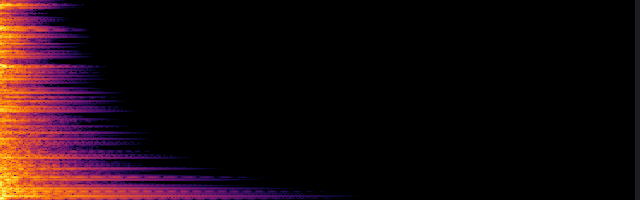
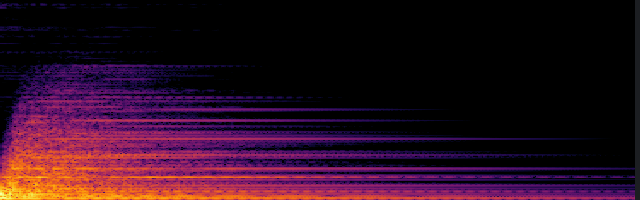
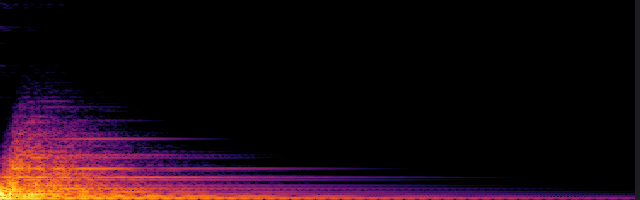
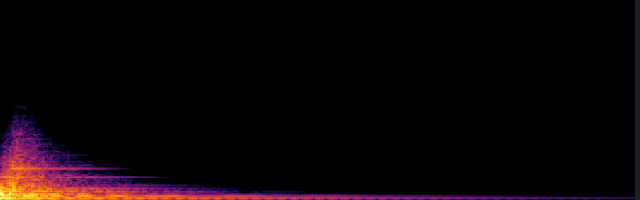
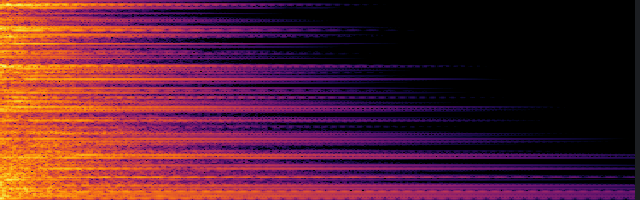
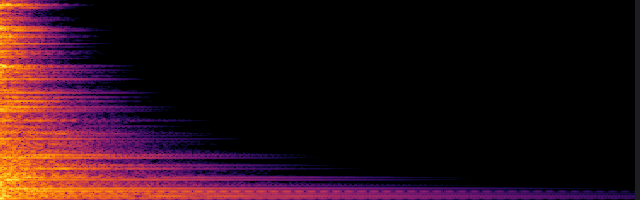
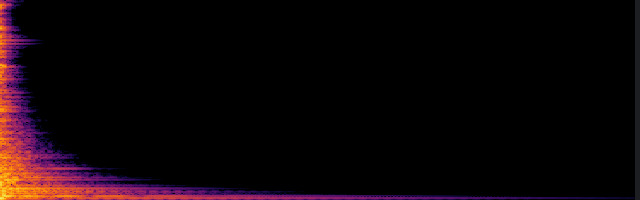
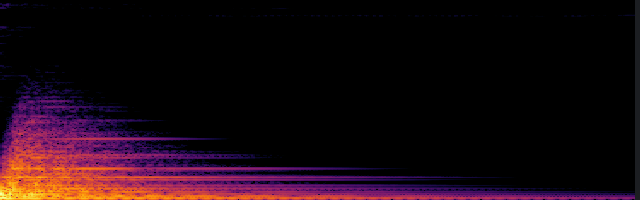
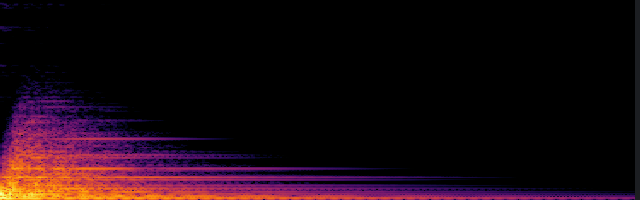
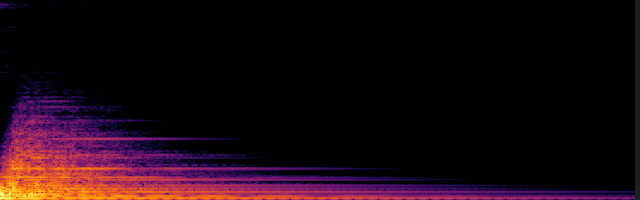
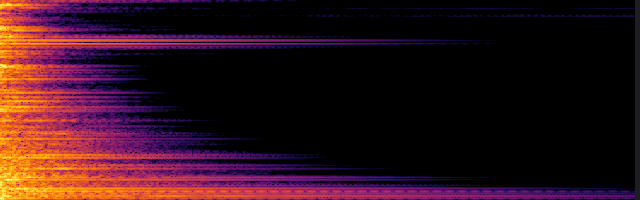
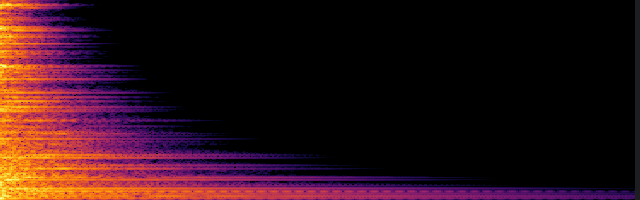
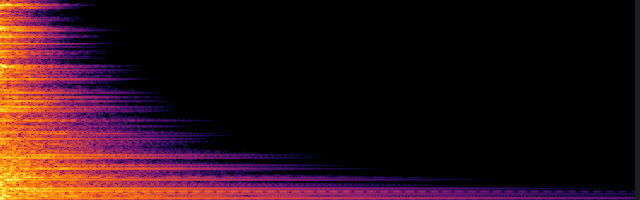
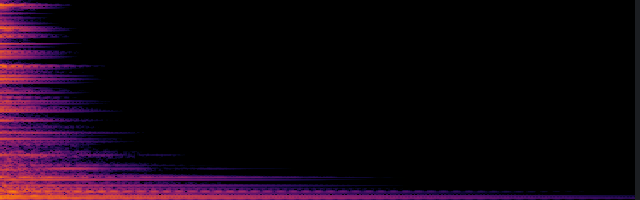
A wooden stick tip (30 g effective mass) strikes the sheet at 70 percent of its width and 35 percent of its height. Speed sets both the loudness and the character: the contact force grows with speed, the contact shortens, and more energy reaches the high modes. In these clips the peak level rises from about 87 dB at 0.5 m/s to 109 dB at 6 m/s, and the spectral centroid from about 190 Hz to 1.6 kHz, so the sound grows brighter as well as louder.

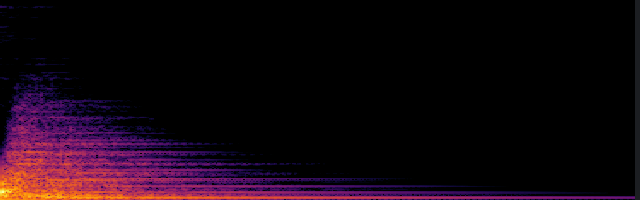
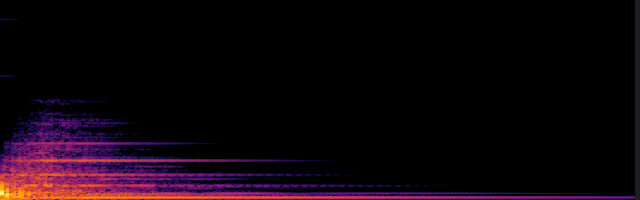
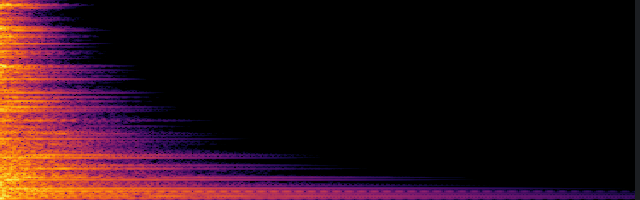
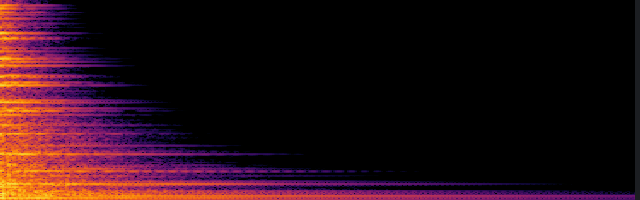
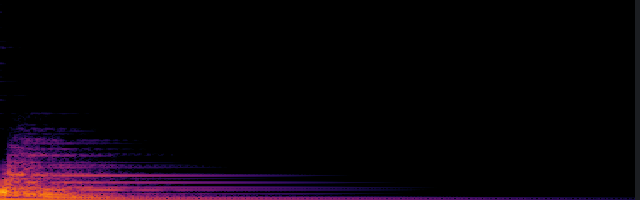
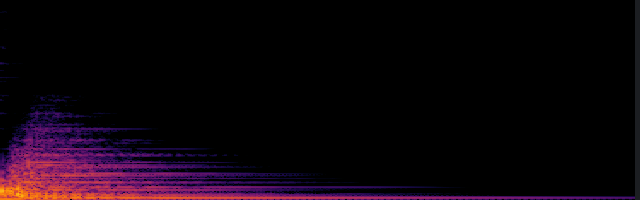
Playback gain +20 dB relative to 1 Pa = 0 dBFS (the simulator's default is +20 dB); loud onsets are soft-clipped. Spectrograms: 0 to 5 kHz over the clip, 80 dB range, one color scale per section.
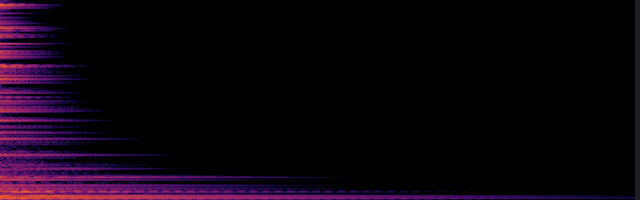
0.5 m/s
spectrogram
peak 0.435 Pa (87 dB SPL)
RMS 1.7 mPa
centroid 192 Hz
T60 100-500 Hz 4.8 s, 2-8 kHz 8.6 s
contact force 28 N
wav peak 12.8 dBFS (soft-clipped)
Open in simulator
1 m/s
spectrogram
peak 0.891 Pa (93 dB SPL)
RMS 3.6 mPa
centroid 259 Hz
T60 100-500 Hz 4.8 s, 2-8 kHz 6.8 s
contact force 58 N
wav peak 19.0 dBFS (soft-clipped)
Open in simulator
2 m/s
spectrogram
peak 1.676 Pa (98 dB SPL)
RMS 7.3 mPa
centroid 317 Hz
T60 100-500 Hz 3.9 s, 2-8 kHz 5.1 s
contact force 124 N
wav peak 24.5 dBFS (soft-clipped)
Open in simulator
3 m/s
spectrogram
peak 2.552 Pa (102 dB SPL)
RMS 10.9 mPa
centroid 655 Hz
T60 100-500 Hz 4.2 s, 2-8 kHz 4.6 s
contact force 195 N
wav peak 28.1 dBFS (soft-clipped)
Open in simulator
4.5 m/s
spectrogram
peak 4.114 Pa (106 dB SPL)
RMS 17.2 mPa
centroid 678 Hz
T60 100-500 Hz 4.4 s, 2-8 kHz 3.8 s
contact force 315 N
wav peak 32.3 dBFS (soft-clipped)
Open in simulator
6 m/s
spectrogram
peak 5.721 Pa (109 dB SPL)
RMS 24.9 mPa
centroid 1654 Hz
T60 100-500 Hz 3.9 s, 2-8 kHz 3.4 s
contact force 448 N
wav peak 35.1 dBFS (soft-clipped)
Open in simulator

Drumstick: stick mass

The same speed with a lighter or heavier stick. A light stick gives a short contact and a bright tap. A heavier stick stays in contact longer, which by itself favours the low modes, but it also pushes the sheet further, and the extra energy reaches the high partials through the nonlinearity. In these clips the two effects roughly cancel between 10 and 60 g, and the 120 g stick is both the loudest and the brightest of the set. The peak contact force changes little with the mass (about 180 N at 10 g and 230 N at 120 g), because the local response of the sheet limits it.

Playback gain +20 dB relative to 1 Pa = 0 dBFS (the simulator's default is +20 dB); loud onsets are soft-clipped. Spectrograms: 0 to 5 kHz over the clip, 80 dB range, one color scale per section.
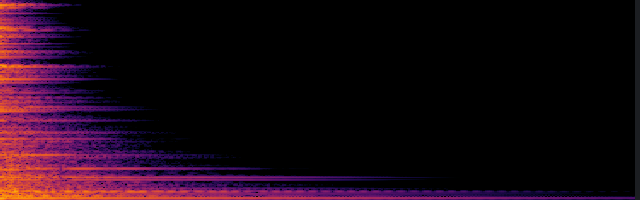
10 g
spectrogram
peak 2.452 Pa (102 dB SPL)
RMS 9.7 mPa
centroid 654 Hz
T60 100-500 Hz 4.3 s, 2-8 kHz 5.2 s
contact force 183 N
wav peak 27.8 dBFS (soft-clipped)
Open in simulator
30 g
spectrogram
peak 2.552 Pa (102 dB SPL)
RMS 10.9 mPa
centroid 655 Hz
T60 100-500 Hz 4.2 s, 2-8 kHz 4.6 s
contact force 195 N
wav peak 28.1 dBFS (soft-clipped)
Open in simulator
60 g
spectrogram
peak 2.578 Pa (102 dB SPL)
RMS 12.3 mPa
centroid 686 Hz
T60 100-500 Hz 4.1 s, 2-8 kHz 3.8 s
contact force 205 N
wav peak 28.2 dBFS (soft-clipped)
Open in simulator
120 g
spectrogram
peak 2.591 Pa (102 dB SPL)
RMS 17.0 mPa
centroid 1346 Hz
T60 100-500 Hz 3.5 s, 2-8 kHz 3.2 s
contact force 232 N
wav peak 28.3 dBFS (soft-clipped)
Open in simulator

Drumstick: tip hardness

The Hertz contact stiffness K stands for the hardness of the tip. A soft (rubber or felt) tip has a low K and a long, gentle contact that excites mainly the low modes: the softest tip here is about 17 dB quieter than the default and has almost no energy above 2 kHz. A hard tip (dense wood, or a metal beater) has a high K and a larger contact force, which makes the strike louder; in these clips the brightness does not increase further beyond the default value.

Playback gain +20 dB relative to 1 Pa = 0 dBFS (the simulator's default is +20 dB); loud onsets are soft-clipped. Spectrograms: 0 to 5 kHz over the clip, 80 dB range, one color scale per section.
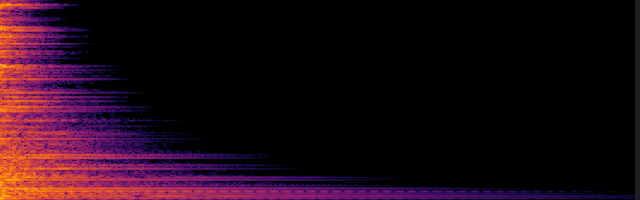
5000000 N/m^1.5
spectrogram
peak 0.380 Pa (86 dB SPL)
RMS 5.1 mPa
centroid 375 Hz
T60 100-500 Hz 4.4 s, 2-8 kHz 4.7 s
contact force 113 N
wav peak 11.6 dBFS (soft-clipped)
Open in simulator
50000000 N/m^1.5
spectrogram
peak 1.436 Pa (97 dB SPL)
RMS 7.9 mPa
centroid 677 Hz
T60 100-500 Hz 4.0 s, 2-8 kHz 4.4 s
contact force 148 N
wav peak 23.1 dBFS (soft-clipped)
Open in simulator
500000000 N/m^1.5
spectrogram
peak 2.552 Pa (102 dB SPL)
RMS 10.9 mPa
centroid 655 Hz
T60 100-500 Hz 4.2 s, 2-8 kHz 4.6 s
contact force 195 N
wav peak 28.1 dBFS (soft-clipped)
Open in simulator
5000000000 N/m^1.5
spectrogram
peak 3.469 Pa (105 dB SPL)
RMS 15.5 mPa
centroid 563 Hz
T60 100-500 Hz 3.8 s, 2-8 kHz 4.5 s
contact force 532 N
wav peak 30.8 dBFS (soft-clipped)
Open in simulator

Drumstick: strike position

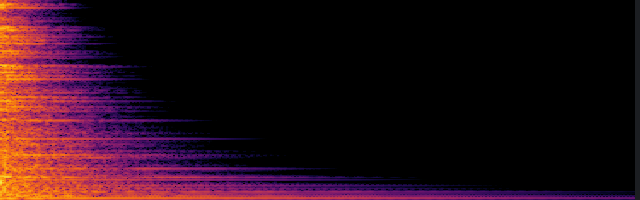
Where the sheet is struck decides which modes are excited: a strike at the center excites only modes that are symmetric about both axes, while a strike near an edge or a corner excites the twisting and edge modes as well. The central strike is the loudest and the lowest of the four, since it drives the low symmetric modes that radiate best; the off-center default is the brightest.

Playback gain +20 dB relative to 1 Pa = 0 dBFS (the simulator's default is +20 dB); loud onsets are soft-clipped. Spectrograms: 0 to 5 kHz over the clip, 80 dB range, one color scale per section.
center
spectrogram
peak 4.090 Pa (106 dB SPL)
RMS 17.4 mPa
centroid 449 Hz
T60 100-500 Hz 4.7 s, 2-8 kHz 3.9 s
contact force 195 N
wav peak 32.2 dBFS (soft-clipped)
Open in simulator
off-center (default)
spectrogram
peak 2.552 Pa (102 dB SPL)
RMS 10.9 mPa
centroid 655 Hz
T60 100-500 Hz 4.2 s, 2-8 kHz 4.6 s
contact force 195 N
wav peak 28.1 dBFS (soft-clipped)
Open in simulator
near the right edge
spectrogram
peak 2.026 Pa (100 dB SPL)
RMS 9.8 mPa
centroid 457 Hz
T60 100-500 Hz 4.2 s, 2-8 kHz 4.5 s
contact force 190 N
wav peak 26.1 dBFS (soft-clipped)
Open in simulator
near a corner
spectrogram
peak 2.641 Pa (102 dB SPL)
RMS 13.0 mPa
centroid 540 Hz
T60 100-500 Hz 4.7 s, 2-8 kHz 4.4 s
contact force 197 N
wav peak 28.4 dBFS (soft-clipped)
Open in simulator

Push and release: push amount

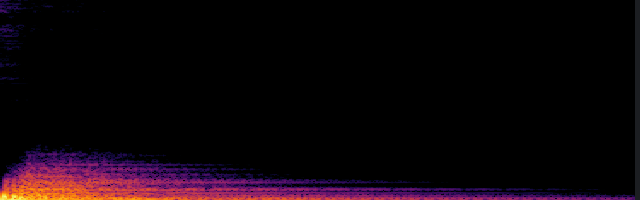
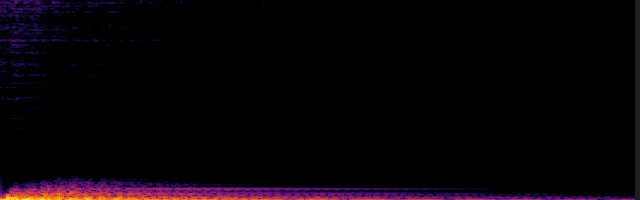
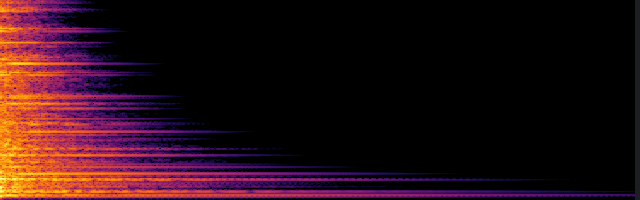
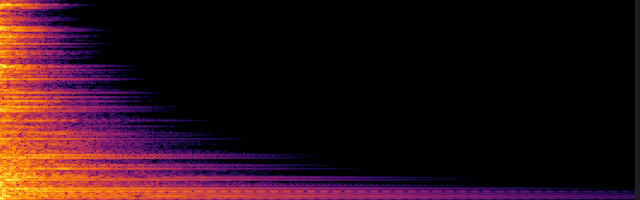
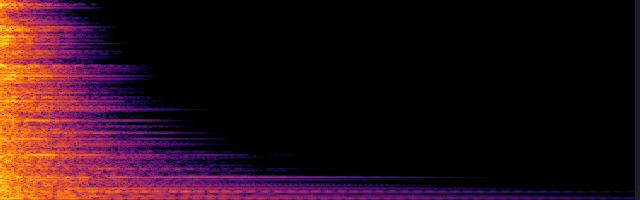
The corner is pushed by a given amount, held until the sheet settles, and released over 20 ms. A larger push stores more energy and, because the stiffness rises with deflection, produces a stronger pitch glide and a stronger transfer of energy to the higher partials. The 2 and 5 mm pushes are nearly linear and very quiet, with most of their sound below 100 Hz; the 20 mm push is about 10 dB louder than the default and has far more energy above 500 Hz.

Playback gain +20 dB relative to 1 Pa = 0 dBFS (the simulator's default is +20 dB); loud onsets are soft-clipped. Spectrograms: 0 to 5 kHz over the clip, 80 dB range, one color scale per section.
2 mm
spectrogram
peak 0.012 Pa (56 dB SPL)
RMS 0.1 mPa
centroid 427 Hz
T60 100-500 Hz 4.8 s, 2-8 kHz 17.5 s
wav peak -18.2 dBFS
Open in simulator
5 mm
spectrogram
peak 0.018 Pa (59 dB SPL)
RMS 0.4 mPa
centroid 179 Hz
T60 100-500 Hz 4.7 s, 2-8 kHz 10.7 s
wav peak -14.7 dBFS
Open in simulator
10 mm
spectrogram
peak 0.046 Pa (67 dB SPL)
RMS 3.3 mPa
centroid 196 Hz
T60 100-500 Hz 4.0 s, 2-8 kHz 7.7 s
wav peak -6.7 dBFS
Open in simulator
20 mm
spectrogram
peak 0.147 Pa (77 dB SPL)
RMS 6.8 mPa
centroid 411 Hz
T60 100-500 Hz 4.2 s, 2-8 kHz 4.2 s
wav peak 3.3 dBFS (soft-clipped)
Open in simulator

Push and release: with or against the bow

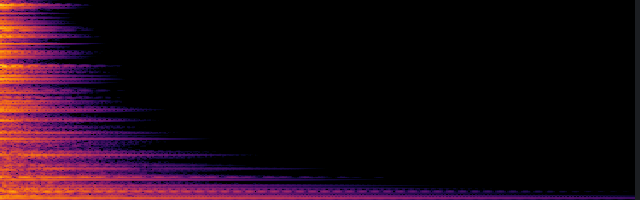
The sheet has a 3 mm bow across its width. Pushing the corner in the direction of the bow and against it are not equivalent: the shell stiffness is asymmetric, so the two cases have different low-mode frequencies and a different wobble. Here the push against the bow gives a quieter and lower sound, with about 20 dB less energy between 500 Hz and 2 kHz.

Playback gain +20 dB relative to 1 Pa = 0 dBFS (the simulator's default is +20 dB); loud onsets are soft-clipped. Spectrograms: 0 to 5 kHz over the clip, 80 dB range, one color scale per section.
+10 mm (with the bow)
spectrogram
peak 0.046 Pa (67 dB SPL)
RMS 3.3 mPa
centroid 196 Hz
T60 100-500 Hz 4.0 s, 2-8 kHz 7.7 s
wav peak -6.7 dBFS
Open in simulator
-10 mm (against the bow)
spectrogram
peak 0.021 Pa (61 dB SPL)
RMS 2.0 mPa
centroid 114 Hz
T60 100-500 Hz 5.1 s, 2-8 kHz 7.6 s
wav peak -13.5 dBFS
Open in simulator

Push and release: release time

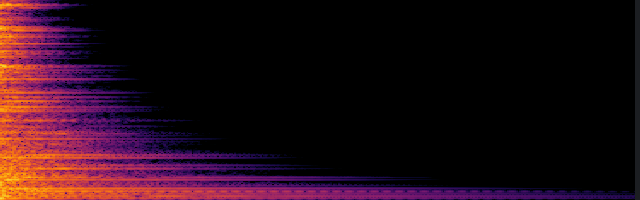
How fast the finger lets go. An instantaneous release is a step in force and excites every mode, giving a click that is about 24 dB louder at its peak than the default; a release over tens of milliseconds excites only the lowest modes, as a fingertip does, and the 50 ms release brings the centroid down to about 100 Hz.

Playback gain +20 dB relative to 1 Pa = 0 dBFS (the simulator's default is +20 dB); loud onsets are soft-clipped. Spectrograms: 0 to 5 kHz over the clip, 80 dB range, one color scale per section.
0 ms
spectrogram
peak 0.764 Pa (92 dB SPL)
RMS 9.0 mPa
centroid 227 Hz
T60 100-500 Hz 4.5 s, 2-8 kHz 4.8 s
wav peak 17.7 dBFS (soft-clipped)
Open in simulator
5 ms
spectrogram
peak 0.052 Pa (68 dB SPL)
RMS 3.8 mPa
centroid 225 Hz
T60 100-500 Hz 4.6 s, 2-8 kHz 5.4 s
wav peak -5.7 dBFS
Open in simulator
20 ms
spectrogram
peak 0.046 Pa (67 dB SPL)
RMS 3.3 mPa
centroid 196 Hz
T60 100-500 Hz 4.0 s, 2-8 kHz 7.7 s
wav peak -6.7 dBFS
Open in simulator
50 ms
spectrogram
peak 0.030 Pa (64 dB SPL)
RMS 2.1 mPa
centroid 103 Hz
T60 100-500 Hz 4.0 s, 2-8 kHz 13.6 s
wav peak -10.4 dBFS
Open in simulator

Sheet: initial bow (push and release)

Real sheet metal has a bow of a few millimetres, which makes it a shallow shell with an asymmetric stiffness. A flat plate has a symmetric, purely hardening nonlinearity; the bowed sheet moves energy out of the inaudible sub-50 Hz range into the audible partials and produces the slow wobble of a real sheet. In these clips the flat plate and the 1.5 mm bow are about 8 dB quieter than the 3 mm bow, and the centroid rises with the bow.

Playback gain +20 dB relative to 1 Pa = 0 dBFS (the simulator's default is +20 dB); loud onsets are soft-clipped. Spectrograms: 0 to 5 kHz over the clip, 80 dB range, one color scale per section.
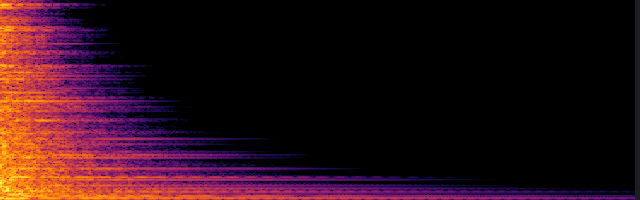
0 mm
spectrogram
peak 0.019 Pa (59 dB SPL)
RMS 1.4 mPa
centroid 139 Hz
T60 100-500 Hz 3.8 s, 2-8 kHz 5.7 s
wav peak -14.6 dBFS
Open in simulator
1.5 mm
spectrogram
peak 0.020 Pa (60 dB SPL)
RMS 1.9 mPa
centroid 151 Hz
T60 100-500 Hz 3.9 s, 2-8 kHz 5.8 s
wav peak -13.8 dBFS
Open in simulator
3 mm
spectrogram
peak 0.046 Pa (67 dB SPL)
RMS 3.3 mPa
centroid 196 Hz
T60 100-500 Hz 4.0 s, 2-8 kHz 7.7 s
wav peak -6.7 dBFS
Open in simulator
6 mm
spectrogram
peak 0.051 Pa (68 dB SPL)
RMS 3.9 mPa
centroid 260 Hz
T60 100-500 Hz 4.7 s, 2-8 kHz 19.0 s
wav peak -5.8 dBFS
Open in simulator

Sheet: initial bow (drumstick strike)

The same sweep excited by the default drumstick strike (30 g at 3 m/s) instead of the corner push. The trend reverses: struck, the flat plate rings brightest, and the 6 mm bow gives the dullest sound, with about 10 dB less energy above 2 kHz than the default, presumably because the curvature couples the bending motion to the in-plane motion and its loss. The peak pressure is the same in all four clips, since the impact itself sets it.

Playback gain +20 dB relative to 1 Pa = 0 dBFS (the simulator's default is +20 dB); loud onsets are soft-clipped. Spectrograms: 0 to 5 kHz over the clip, 80 dB range, one color scale per section.
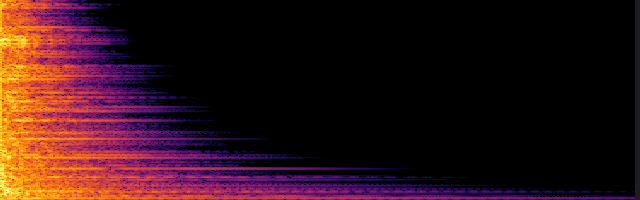
0 mm
spectrogram
peak 2.552 Pa (102 dB SPL)
RMS 10.7 mPa
centroid 674 Hz
T60 100-500 Hz 3.6 s, 2-8 kHz 3.4 s
contact force 196 N
wav peak 28.1 dBFS (soft-clipped)
Open in simulator
1.5 mm
spectrogram
peak 2.552 Pa (102 dB SPL)
RMS 10.7 mPa
centroid 601 Hz
T60 100-500 Hz 4.1 s, 2-8 kHz 3.3 s
contact force 195 N
wav peak 28.1 dBFS (soft-clipped)
Open in simulator
3 mm
spectrogram
peak 2.552 Pa (102 dB SPL)
RMS 10.9 mPa
centroid 655 Hz
T60 100-500 Hz 4.2 s, 2-8 kHz 4.6 s
contact force 195 N
wav peak 28.1 dBFS (soft-clipped)
Open in simulator
6 mm
spectrogram
peak 2.552 Pa (102 dB SPL)
RMS 13.3 mPa
centroid 291 Hz
T60 100-500 Hz 4.6 s, 2-8 kHz 6.3 s
contact force 195 N
wav peak 28.1 dBFS (soft-clipped)
Open in simulator

Sheet: shape of the bow (push and release)

The same 3 mm sag as a bow across the width, across the height, or as a dish curved both ways. With the push at a corner, the bow across the width gives the loudest and brightest sound and the bow across the height the lowest.

Playback gain +20 dB relative to 1 Pa = 0 dBFS (the simulator's default is +20 dB); loud onsets are soft-clipped. Spectrograms: 0 to 5 kHz over the clip, 80 dB range, one color scale per section.
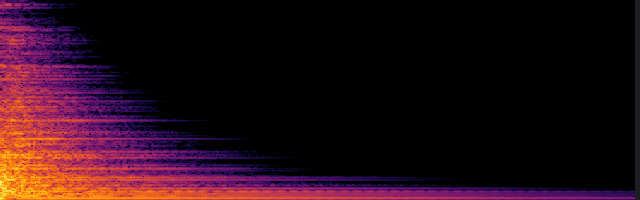
across the width
spectrogram
peak 0.046 Pa (67 dB SPL)
RMS 3.3 mPa
centroid 196 Hz
T60 100-500 Hz 4.0 s, 2-8 kHz 7.7 s
wav peak -6.7 dBFS
Open in simulator
across the height
spectrogram
peak 0.030 Pa (63 dB SPL)
RMS 2.0 mPa
centroid 141 Hz
T60 100-500 Hz 4.9 s, 2-8 kHz 7.8 s
wav peak -10.5 dBFS
Open in simulator
dish
spectrogram
peak 0.037 Pa (65 dB SPL)
RMS 2.7 mPa
centroid 155 Hz
T60 100-500 Hz 4.7 s, 2-8 kHz 6.6 s
wav peak -8.7 dBFS
Open in simulator

Sheet: shape of the bow (drumstick strike)

The same sweep excited by the default drumstick strike (30 g at 3 m/s) instead of the corner push. The bow across the height again gives the lowest sound (a centroid near 460 Hz against 650 Hz for the bow across the width), while the peak pressure is the same for all three.

Playback gain +20 dB relative to 1 Pa = 0 dBFS (the simulator's default is +20 dB); loud onsets are soft-clipped. Spectrograms: 0 to 5 kHz over the clip, 80 dB range, one color scale per section.
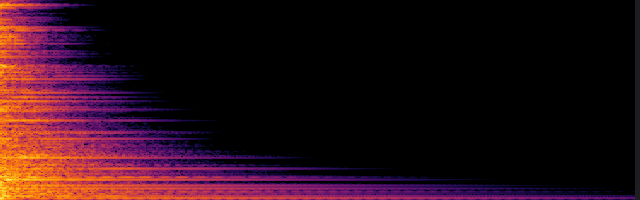
across the width
spectrogram
peak 2.552 Pa (102 dB SPL)
RMS 10.9 mPa
centroid 655 Hz
T60 100-500 Hz 4.2 s, 2-8 kHz 4.6 s
contact force 195 N
wav peak 28.1 dBFS (soft-clipped)
Open in simulator
across the height
spectrogram
peak 2.552 Pa (102 dB SPL)
RMS 10.9 mPa
centroid 464 Hz
T60 100-500 Hz 4.2 s, 2-8 kHz 4.2 s
contact force 195 N
wav peak 28.1 dBFS (soft-clipped)
Open in simulator
dish
spectrogram
peak 2.552 Pa (102 dB SPL)
RMS 10.9 mPa
centroid 618 Hz
T60 100-500 Hz 4.6 s, 2-8 kHz 4.1 s
contact force 195 N
wav peak 28.1 dBFS (soft-clipped)
Open in simulator

Sheet: thickness (push and release)

Bending stiffness grows with the cube of the thickness while mass grows linearly, so a thicker sheet has higher mode frequencies. The same 10 mm push, however, is a smaller multiple of the thickness, which weakens the nonlinear transfer of energy to the higher partials, and in these clips this effect wins: the sound becomes lower and purer with thickness even though the individual modes rise. Gauges 24, 22, 18 and 14.

Playback gain +20 dB relative to 1 Pa = 0 dBFS (the simulator's default is +20 dB); loud onsets are soft-clipped. Spectrograms: 0 to 5 kHz over the clip, 80 dB range, one color scale per section.
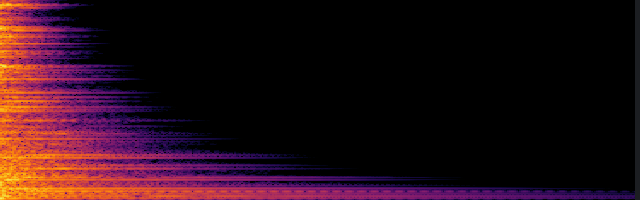
0.6 mm
spectrogram
peak 0.027 Pa (63 dB SPL)
RMS 2.1 mPa
centroid 188 Hz
T60 100-500 Hz 3.4 s, 2-8 kHz 7.9 s
wav peak -11.4 dBFS
Open in simulator
0.79 mm
spectrogram
peak 0.046 Pa (67 dB SPL)
RMS 3.3 mPa
centroid 196 Hz
T60 100-500 Hz 4.0 s, 2-8 kHz 7.7 s
wav peak -6.7 dBFS
Open in simulator
1.2 mm
spectrogram
peak 0.069 Pa (71 dB SPL)
RMS 5.9 mPa
centroid 120 Hz
T60 100-500 Hz 4.9 s, 2-8 kHz 7.4 s
wav peak -3.2 dBFS
Open in simulator
2 mm
spectrogram
peak 0.052 Pa (68 dB SPL)
RMS 7.7 mPa
centroid 97 Hz
T60 100-500 Hz 5.2 s, 2-8 kHz 7.3 s
wav peak -5.6 dBFS
Open in simulator

Sheet: thickness (drumstick strike)

The same sweep excited by the default drumstick strike (30 g at 3 m/s) instead of the corner push. Struck, the trend is the opposite: the stick meets a stiffer sheet with a shorter, harder contact (the peak contact force rises from about 170 N at 0.6 mm to 700 N at 2 mm), so the thick sheets are louder and much brighter.

Playback gain +20 dB relative to 1 Pa = 0 dBFS (the simulator's default is +20 dB); loud onsets are soft-clipped. Spectrograms: 0 to 5 kHz over the clip, 80 dB range, one color scale per section.
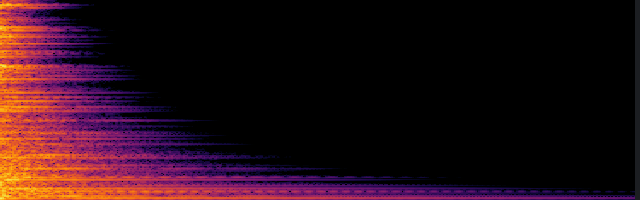
0.6 mm
spectrogram
peak 2.616 Pa (102 dB SPL)
RMS 10.5 mPa
centroid 634 Hz
T60 100-500 Hz 4.5 s, 2-8 kHz 5.0 s
contact force 168 N
wav peak 28.4 dBFS (soft-clipped)
Open in simulator
0.79 mm
spectrogram
peak 2.552 Pa (102 dB SPL)
RMS 10.9 mPa
centroid 655 Hz
T60 100-500 Hz 4.2 s, 2-8 kHz 4.6 s
contact force 195 N
wav peak 28.1 dBFS (soft-clipped)
Open in simulator
1.2 mm
spectrogram
peak 3.749 Pa (105 dB SPL)
RMS 15.9 mPa
centroid 1009 Hz
T60 100-500 Hz 4.4 s, 2-8 kHz 3.3 s
contact force 348 N
wav peak 31.5 dBFS (soft-clipped)
Open in simulator
2 mm
spectrogram
peak 3.795 Pa (106 dB SPL)
RMS 22.2 mPa
centroid 2181 Hz
T60 100-500 Hz 5.0 s, 2-8 kHz 2.5 s
contact force 699 N
wav peak 31.6 dBFS (soft-clipped)
Open in simulator

Sheet: size (push and release)

Plate dimensions (width by height) at the same thickness. Mode frequencies scale with the inverse square of the size, so a larger sheet is lower and slower, and under the same 10 mm push it also stores less energy and sounds quieter. The 24 by 36 inch sheet is an extreme case: its lowest modes lie near 10 Hz, below hearing, and most of its peak pressure is this infrasound, so it sounds much fainter than its sound pressure level suggests.

Playback gain +20 dB relative to 1 Pa = 0 dBFS (the simulator's default is +20 dB); loud onsets are soft-clipped. Spectrograms: 0 to 5 kHz over the clip, 80 dB range, one color scale per section.
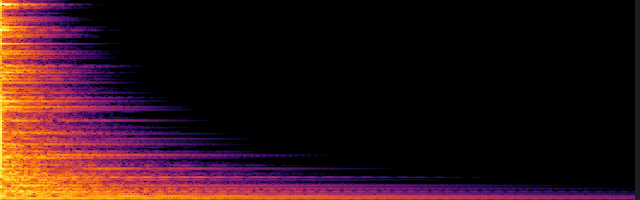
8 x 12 in
spectrogram
peak 0.064 Pa (70 dB SPL)
RMS 3.6 mPa
centroid 300 Hz
T60 100-500 Hz 4.4 s, 2-8 kHz 6.5 s
wav peak -3.8 dBFS
Open in simulator
12 x 18 in (default)
spectrogram
peak 0.046 Pa (67 dB SPL)
RMS 3.3 mPa
centroid 196 Hz
T60 100-500 Hz 4.0 s, 2-8 kHz 7.7 s
wav peak -6.7 dBFS
Open in simulator
18 x 24 in
spectrogram
peak 0.029 Pa (63 dB SPL)
RMS 2.3 mPa
centroid 122 Hz
T60 100-500 Hz 4.1 s, 2-8 kHz 7.3 s
wav peak -10.8 dBFS
Open in simulator
24 x 36 in
spectrogram
peak 0.256 Pa (82 dB SPL)
RMS 2.2 mPa
centroid 532 Hz
T60 100-500 Hz 4.2 s, 2-8 kHz 6.2 s
wav peak 8.2 dBFS (soft-clipped)
Open in simulator

Sheet: size (drumstick strike)

The same sweep excited by the default drumstick strike (30 g at 3 m/s) instead of the corner push. Struck, the larger sheets are louder and lower, the 18 by 24 inch sheet reaching about 105 dB at its peak against 100 dB for the smallest; the 24 by 36 inch sheet again puts much of its energy below 100 Hz.

Playback gain +20 dB relative to 1 Pa = 0 dBFS (the simulator's default is +20 dB); loud onsets are soft-clipped. Spectrograms: 0 to 5 kHz over the clip, 80 dB range, one color scale per section.
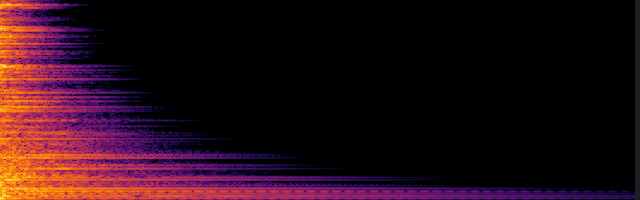
8 x 12 in
spectrogram
peak 1.956 Pa (100 dB SPL)
RMS 8.8 mPa
centroid 968 Hz
T60 100-500 Hz 4.4 s, 2-8 kHz 4.7 s
contact force 196 N
wav peak 25.8 dBFS (soft-clipped)
Open in simulator
12 x 18 in (default)
spectrogram
peak 2.552 Pa (102 dB SPL)
RMS 10.9 mPa
centroid 655 Hz
T60 100-500 Hz 4.2 s, 2-8 kHz 4.6 s
contact force 195 N
wav peak 28.1 dBFS (soft-clipped)
Open in simulator
18 x 24 in
spectrogram
peak 3.582 Pa (105 dB SPL)
RMS 14.4 mPa
centroid 397 Hz
T60 100-500 Hz 3.8 s, 2-8 kHz 4.6 s
contact force 195 N
wav peak 31.1 dBFS (soft-clipped)
Open in simulator
24 x 36 in
spectrogram
peak 2.823 Pa (103 dB SPL)
RMS 17.4 mPa
centroid 453 Hz
T60 100-500 Hz 3.9 s, 2-8 kHz 4.5 s
contact force 167 N
wav peak 29.0 dBFS (soft-clipped)
Open in simulator

Sheet: outline at equal area (push and release)

Four outlines cut from the same amount of steel (216 square inches, the area of the default 12 by 18 inch sheet): the rectangle, a square, the ellipse of the same 2:3 proportions, and a circle. Everything else is held at the defaults, including the 3 mm bow across the width. The push acts at a corner for the rectangle and the square and at the rim point opposite the hole for the ellipse and the circle, so part of the difference is the excitation itself: a rim point of an ellipse is stiffer than the corner of a rectangle, and the same 10 mm push deforms the whole sheet rather than bending a corner.

Playback gain +20 dB relative to 1 Pa = 0 dBFS (the simulator's default is +20 dB); loud onsets are soft-clipped. Spectrograms: 0 to 5 kHz over the clip, 80 dB range, one color scale per section.
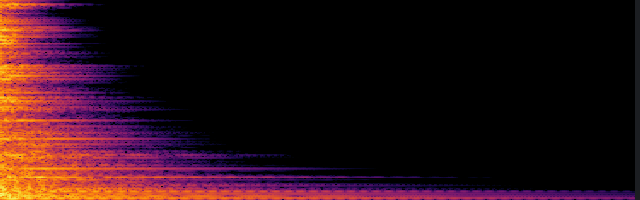
rectangle 12 x 18 in
spectrogram
peak 0.046 Pa (67 dB SPL)
RMS 3.3 mPa
centroid 196 Hz
T60 100-500 Hz 4.0 s, 2-8 kHz 7.7 s
wav peak -6.7 dBFS
Open in simulator
square 14.7 x 14.7 in
spectrogram
peak 0.042 Pa (67 dB SPL)
RMS 2.9 mPa
centroid 154 Hz
T60 100-500 Hz 3.8 s, 2-8 kHz 9.8 s
wav peak -7.5 dBFS
Open in simulator
ellipse 13.5 x 20.3 in
spectrogram
peak 0.148 Pa (77 dB SPL)
RMS 6.3 mPa
centroid 151 Hz
T60 100-500 Hz 3.6 s, 2-8 kHz 5.0 s
wav peak 3.4 dBFS (soft-clipped)
Open in simulator
circle 16.6 in
spectrogram
peak 0.158 Pa (78 dB SPL)
RMS 5.8 mPa
centroid 204 Hz
T60 100-500 Hz 4.1 s, 2-8 kHz 5.9 s
wav peak 4.0 dBFS (soft-clipped)
Open in simulator

Sheet: outline at equal area (drumstick strike)

The same sweep excited by the default drumstick strike (30 g at 3 m/s) instead of the push. The strike point is at the same fraction of the width and height in every case.

Playback gain +20 dB relative to 1 Pa = 0 dBFS (the simulator's default is +20 dB); loud onsets are soft-clipped. Spectrograms: 0 to 5 kHz over the clip, 80 dB range, one color scale per section.
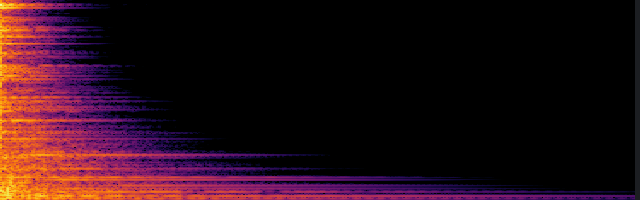
rectangle 12 x 18 in
spectrogram
peak 2.552 Pa (102 dB SPL)
RMS 10.9 mPa
centroid 655 Hz
T60 100-500 Hz 4.2 s, 2-8 kHz 4.6 s
contact force 195 N
wav peak 28.1 dBFS (soft-clipped)
Open in simulator
square 14.7 x 14.7 in
spectrogram
peak 2.443 Pa (102 dB SPL)
RMS 10.3 mPa
centroid 458 Hz
T60 100-500 Hz 4.8 s, 2-8 kHz 4.6 s
contact force 194 N
wav peak 27.8 dBFS (soft-clipped)
Open in simulator
ellipse 13.5 x 20.3 in
spectrogram
peak 2.461 Pa (102 dB SPL)
RMS 10.0 mPa
centroid 602 Hz
T60 100-500 Hz 3.6 s, 2-8 kHz 4.4 s
contact force 195 N
wav peak 27.8 dBFS (soft-clipped)
Open in simulator
circle 16.6 in
spectrogram
peak 2.487 Pa (102 dB SPL)
RMS 10.0 mPa
centroid 280 Hz
T60 100-500 Hz 3.5 s, 2-8 kHz 4.5 s
contact force 194 N
wav peak 27.9 dBFS (soft-clipped)
Open in simulator

Ellipse: size (push and release)

Elliptical sheets inscribed in the same bounding boxes as the rectangular size sweep above, pushed 10 mm at the rim.

Playback gain +20 dB relative to 1 Pa = 0 dBFS (the simulator's default is +20 dB); loud onsets are soft-clipped. Spectrograms: 0 to 5 kHz over the clip, 80 dB range, one color scale per section.
8 x 12 in
spectrogram
peak 0.064 Pa (70 dB SPL)
RMS 4.7 mPa
centroid 216 Hz
T60 100-500 Hz 4.7 s, 2-8 kHz 5.1 s
wav peak -3.9 dBFS
Open in simulator
12 x 18 in
spectrogram
peak 0.119 Pa (76 dB SPL)
RMS 6.5 mPa
centroid 528 Hz
T60 100-500 Hz 3.7 s, 2-8 kHz 3.7 s
wav peak 1.5 dBFS (soft-clipped)
Open in simulator
18 x 24 in
spectrogram
peak 0.145 Pa (77 dB SPL)
RMS 6.6 mPa
centroid 125 Hz
T60 100-500 Hz 4.1 s, 2-8 kHz 6.4 s
wav peak 3.3 dBFS (soft-clipped)
Open in simulator
24 x 36 in
spectrogram
peak 0.130 Pa (76 dB SPL)
RMS 3.3 mPa
centroid 210 Hz
T60 100-500 Hz 4.1 s, 2-8 kHz 6.1 s
wav peak 2.3 dBFS (soft-clipped)
Open in simulator

Ellipse: size (drumstick strike)

The same sweep excited by the default drumstick strike (30 g at 3 m/s) instead of the push.

Playback gain +20 dB relative to 1 Pa = 0 dBFS (the simulator's default is +20 dB); loud onsets are soft-clipped. Spectrograms: 0 to 5 kHz over the clip, 80 dB range, one color scale per section.
8 x 12 in
spectrogram
peak 1.956 Pa (100 dB SPL)
RMS 8.0 mPa
centroid 513 Hz
T60 100-500 Hz 4.8 s, 2-8 kHz 4.3 s
contact force 198 N
wav peak 25.8 dBFS (soft-clipped)
Open in simulator
12 x 18 in
spectrogram
peak 2.218 Pa (101 dB SPL)
RMS 8.9 mPa
centroid 748 Hz
T60 100-500 Hz 3.5 s, 2-8 kHz 4.0 s
contact force 195 N
wav peak 26.9 dBFS (soft-clipped)
Open in simulator
18 x 24 in
spectrogram
peak 3.235 Pa (104 dB SPL)
RMS 12.0 mPa
centroid 438 Hz
T60 100-500 Hz 4.0 s, 2-8 kHz 4.3 s
contact force 195 N
wav peak 30.2 dBFS (soft-clipped)
Open in simulator
24 x 36 in
spectrogram
peak 2.523 Pa (102 dB SPL)
RMS 14.1 mPa
centroid 306 Hz
T60 100-500 Hz 4.0 s, 2-8 kHz 4.4 s
contact force 167 N
wav peak 28.0 dBFS (soft-clipped)
Open in simulator

Ellipse: initial bow (push and release)

The 12 by 18 inch ellipse with a flat shape and with bows of 1.5, 3 and 6 mm across the width, pushed 10 mm at the rim.

Playback gain +20 dB relative to 1 Pa = 0 dBFS (the simulator's default is +20 dB); loud onsets are soft-clipped. Spectrograms: 0 to 5 kHz over the clip, 80 dB range, one color scale per section.
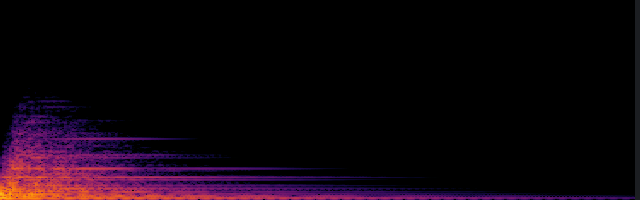
0 mm
spectrogram
peak 0.053 Pa (69 dB SPL)
RMS 2.8 mPa
centroid 156 Hz
T60 100-500 Hz 3.2 s, 2-8 kHz 5.2 s
wav peak -5.5 dBFS
Open in simulator
1.5 mm
spectrogram
peak 0.074 Pa (71 dB SPL)
RMS 4.1 mPa
centroid 160 Hz
T60 100-500 Hz 3.1 s, 2-8 kHz 4.3 s
wav peak -2.6 dBFS
Open in simulator
3 mm
spectrogram
peak 0.119 Pa (76 dB SPL)
RMS 6.5 mPa
centroid 528 Hz
T60 100-500 Hz 3.7 s, 2-8 kHz 3.7 s
wav peak 1.5 dBFS (soft-clipped)
Open in simulator
6 mm
spectrogram
peak 0.281 Pa (83 dB SPL)
RMS 10.2 mPa
centroid 337 Hz
T60 100-500 Hz 5.2 s, 2-8 kHz 5.2 s
wav peak 9.0 dBFS (soft-clipped)
Open in simulator

Ellipse: initial bow (drumstick strike)

The same sweep excited by the default drumstick strike (30 g at 3 m/s) instead of the push.

Playback gain +20 dB relative to 1 Pa = 0 dBFS (the simulator's default is +20 dB); loud onsets are soft-clipped. Spectrograms: 0 to 5 kHz over the clip, 80 dB range, one color scale per section.
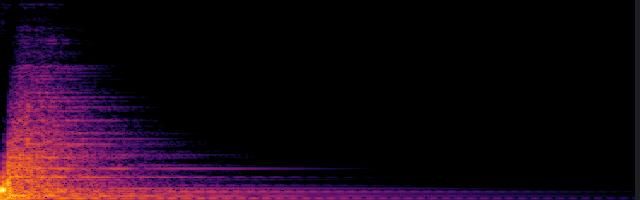
0 mm
spectrogram
peak 2.217 Pa (101 dB SPL)
RMS 8.6 mPa
centroid 923 Hz
T60 100-500 Hz 3.6 s, 2-8 kHz 3.1 s
contact force 196 N
wav peak 26.9 dBFS (soft-clipped)
Open in simulator
1.5 mm
spectrogram
peak 2.217 Pa (101 dB SPL)
RMS 8.8 mPa
centroid 632 Hz
T60 100-500 Hz 3.6 s, 2-8 kHz 3.2 s
contact force 196 N
wav peak 26.9 dBFS (soft-clipped)
Open in simulator
3 mm
spectrogram
peak 2.218 Pa (101 dB SPL)
RMS 8.9 mPa
centroid 748 Hz
T60 100-500 Hz 3.5 s, 2-8 kHz 4.0 s
contact force 195 N
wav peak 26.9 dBFS (soft-clipped)
Open in simulator
6 mm
spectrogram
peak 2.217 Pa (101 dB SPL)
RMS 10.8 mPa
centroid 311 Hz
T60 100-500 Hz 5.3 s, 2-8 kHz 5.3 s
contact force 195 N
wav peak 26.9 dBFS (soft-clipped)
Open in simulator

Ellipse: shape of the bow (push and release)

The same 3 mm sag on the 12 by 18 inch ellipse as a bow across the width, across the height, or as a dish curved both ways.

Playback gain +20 dB relative to 1 Pa = 0 dBFS (the simulator's default is +20 dB); loud onsets are soft-clipped. Spectrograms: 0 to 5 kHz over the clip, 80 dB range, one color scale per section.
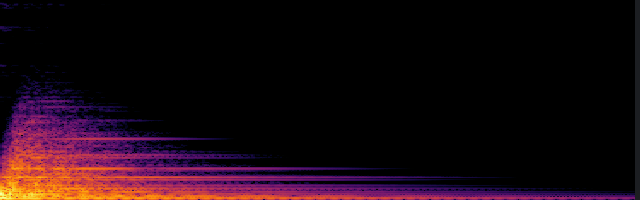
across the width
spectrogram
peak 0.119 Pa (76 dB SPL)
RMS 6.5 mPa
centroid 528 Hz
T60 100-500 Hz 3.7 s, 2-8 kHz 3.7 s
wav peak 1.5 dBFS (soft-clipped)
Open in simulator
across the height
spectrogram
peak 0.069 Pa (71 dB SPL)
RMS 4.2 mPa
centroid 205 Hz
T60 100-500 Hz 3.7 s, 2-8 kHz 6.3 s
wav peak -3.2 dBFS
Open in simulator
dish
spectrogram
peak 0.116 Pa (75 dB SPL)
RMS 5.2 mPa
centroid 319 Hz
T60 100-500 Hz 3.6 s, 2-8 kHz 4.3 s
wav peak 1.3 dBFS (soft-clipped)
Open in simulator

Ellipse: shape of the bow (drumstick strike)

The same sweep excited by the default drumstick strike (30 g at 3 m/s) instead of the push.

Playback gain +20 dB relative to 1 Pa = 0 dBFS (the simulator's default is +20 dB); loud onsets are soft-clipped. Spectrograms: 0 to 5 kHz over the clip, 80 dB range, one color scale per section.
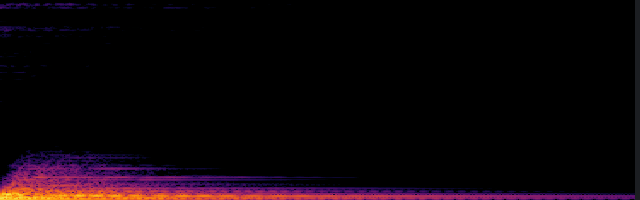
across the width
spectrogram
peak 2.218 Pa (101 dB SPL)
RMS 8.9 mPa
centroid 748 Hz
T60 100-500 Hz 3.5 s, 2-8 kHz 4.0 s
contact force 195 N
wav peak 26.9 dBFS (soft-clipped)
Open in simulator
across the height
spectrogram
peak 2.218 Pa (101 dB SPL)
RMS 8.8 mPa
centroid 489 Hz
T60 100-500 Hz 3.8 s, 2-8 kHz 3.9 s
contact force 196 N
wav peak 26.9 dBFS (soft-clipped)
Open in simulator
dish
spectrogram
peak 2.218 Pa (101 dB SPL)
RMS 8.9 mPa
centroid 504 Hz
T60 100-500 Hz 3.6 s, 2-8 kHz 3.5 s
contact force 195 N
wav peak 26.9 dBFS (soft-clipped)
Open in simulator

Sheet: material (push and release)

Stainless steel, aluminium, and brass at the same thickness. The mode frequencies scale with the square root of E over rho, which is nearly the same for steel and aluminium but about 30 percent lower for brass, so the brass sheet sounds lower and, under the same push, about 7 dB quieter. The loss parameters are kept fixed, although real materials differ there too.

Playback gain +20 dB relative to 1 Pa = 0 dBFS (the simulator's default is +20 dB); loud onsets are soft-clipped. Spectrograms: 0 to 5 kHz over the clip, 80 dB range, one color scale per section.
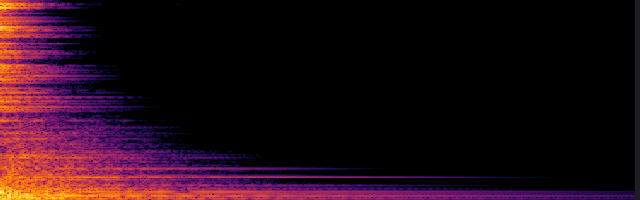
stainless steel
spectrogram
peak 0.046 Pa (67 dB SPL)
RMS 3.3 mPa
centroid 196 Hz
T60 100-500 Hz 4.0 s, 2-8 kHz 7.7 s
wav peak -6.7 dBFS
Open in simulator
aluminium
spectrogram
peak 0.050 Pa (68 dB SPL)
RMS 3.5 mPa
centroid 183 Hz
T60 100-500 Hz 4.6 s, 2-8 kHz 6.7 s
wav peak -6.0 dBFS
Open in simulator
brass
spectrogram
peak 0.022 Pa (61 dB SPL)
RMS 1.4 mPa
centroid 126 Hz
T60 100-500 Hz 3.4 s, 2-8 kHz 7.2 s
wav peak -13.3 dBFS
Open in simulator

Sheet: material (drumstick strike)

The same sweep excited by the default drumstick strike (30 g at 3 m/s) instead of the corner push. Struck, the aluminium sheet, at about a third of the mass of the steel one, is the loudest and by far the brightest (a centroid near 1.3 kHz), and the brass sheet is the lowest.

Playback gain +20 dB relative to 1 Pa = 0 dBFS (the simulator's default is +20 dB); loud onsets are soft-clipped. Spectrograms: 0 to 5 kHz over the clip, 80 dB range, one color scale per section.
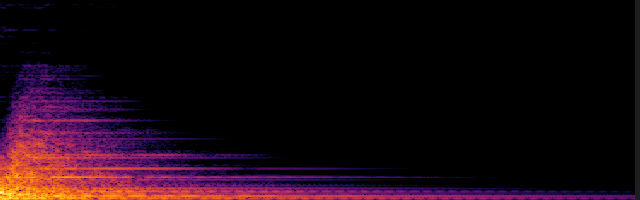
stainless steel
spectrogram
peak 2.552 Pa (102 dB SPL)
RMS 10.9 mPa
centroid 655 Hz
T60 100-500 Hz 4.2 s, 2-8 kHz 4.6 s
contact force 195 N
wav peak 28.1 dBFS (soft-clipped)
Open in simulator
aluminium
spectrogram
peak 3.361 Pa (105 dB SPL)
RMS 19.2 mPa
centroid 1280 Hz
T60 100-500 Hz 4.1 s, 2-8 kHz 3.5 s
contact force 106 N
wav peak 30.5 dBFS (soft-clipped)
Open in simulator
brass
spectrogram
peak 3.476 Pa (105 dB SPL)
RMS 13.6 mPa
centroid 366 Hz
T60 100-500 Hz 4.0 s, 2-8 kHz 5.4 s
contact force 199 N
wav peak 30.8 dBFS (soft-clipped)
Open in simulator

Damping: frequency-independent loss (push and release)

sigma0 sets the decay of the lowest modes (T60 = 6.9 / sigma0). It stands in for everything that damps the sheet uniformly: the suspension, air drag, the material. In the clips the band below 100 Hz decays in roughly 12, 5 and 2 s (the 4 s clip cannot resolve the longest time well). A lower loss also leaves more time for the nonlinear transfer to the higher partials, so the less damped sheet is brighter as well as longer.

Playback gain +20 dB relative to 1 Pa = 0 dBFS (the simulator's default is +20 dB); loud onsets are soft-clipped. Spectrograms: 0 to 5 kHz over the clip, 80 dB range, one color scale per section.
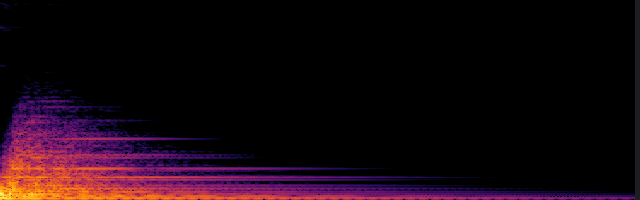
0.4 1/s
spectrogram
peak 0.047 Pa (67 dB SPL)
RMS 3.7 mPa
centroid 287 Hz
T60 100-500 Hz 7.8 s, 2-8 kHz 6.6 s
wav peak -6.6 dBFS
Open in simulator
1.15 1/s
spectrogram
peak 0.046 Pa (67 dB SPL)
RMS 3.3 mPa
centroid 196 Hz
T60 100-500 Hz 4.0 s, 2-8 kHz 7.7 s
wav peak -6.7 dBFS
Open in simulator
3.5 1/s
spectrogram
peak 0.046 Pa (67 dB SPL)
RMS 2.5 mPa
centroid 153 Hz
T60 100-500 Hz 1.8 s, 2-8 kHz 13.7 s
wav peak -6.8 dBFS
Open in simulator

Damping: frequency-independent loss (drumstick strike)

The same sweep excited by the default drumstick strike (30 g at 3 m/s) instead of the corner push. The decay of the low band follows the same rule, while the brightness changes less than it does under the push.

Playback gain +20 dB relative to 1 Pa = 0 dBFS (the simulator's default is +20 dB); loud onsets are soft-clipped. Spectrograms: 0 to 5 kHz over the clip, 80 dB range, one color scale per section.
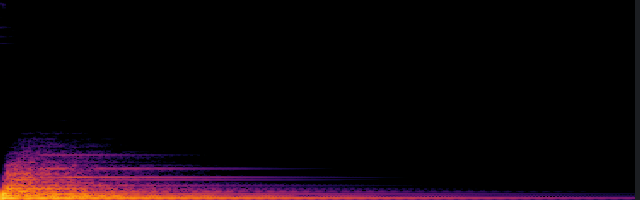
0.4 1/s
spectrogram
peak 2.552 Pa (102 dB SPL)
RMS 11.2 mPa
centroid 606 Hz
T60 100-500 Hz 6.3 s, 2-8 kHz 4.0 s
contact force 195 N
wav peak 28.1 dBFS (soft-clipped)
Open in simulator
1.15 1/s
spectrogram
peak 2.552 Pa (102 dB SPL)
RMS 10.9 mPa
centroid 655 Hz
T60 100-500 Hz 4.2 s, 2-8 kHz 4.6 s
contact force 195 N
wav peak 28.1 dBFS (soft-clipped)
Open in simulator
3.5 1/s
spectrogram
peak 2.552 Pa (102 dB SPL)
RMS 10.6 mPa
centroid 513 Hz
T60 100-500 Hz 1.9 s, 2-8 kHz 5.9 s
contact force 195 N
wav peak 28.1 dBFS (soft-clipped)
Open in simulator

Damping: frequency-dependent loss (push and release)

sigma1 makes the high modes decay faster, in proportion to the square of their wavenumber; it stands mainly for radiation into the air. Too little and the highs ring like a cymbal; too much and the sheet sounds dull. At the lowest value here the band above 2 kHz decays about as slowly as the low modes; at the highest it sits more than 50 dB below the 100 to 500 Hz band.

Playback gain +20 dB relative to 1 Pa = 0 dBFS (the simulator's default is +20 dB); loud onsets are soft-clipped. Spectrograms: 0 to 5 kHz over the clip, 80 dB range, one color scale per section.
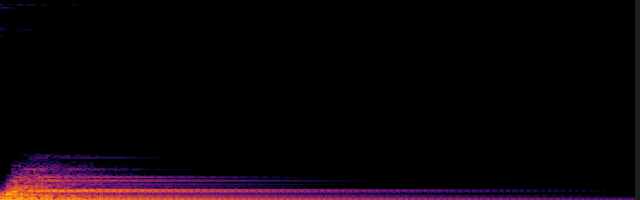
0.0001 m^2/s
spectrogram
peak 0.047 Pa (67 dB SPL)
RMS 3.6 mPa
centroid 238 Hz
T60 100-500 Hz 4.8 s, 2-8 kHz 4.2 s
wav peak -6.6 dBFS
Open in simulator
0.0005 m^2/s
spectrogram
peak 0.046 Pa (67 dB SPL)
RMS 3.3 mPa
centroid 196 Hz
T60 100-500 Hz 4.0 s, 2-8 kHz 7.7 s
wav peak -6.7 dBFS
Open in simulator
0.0025 m^2/s
spectrogram
peak 0.046 Pa (67 dB SPL)
RMS 2.9 mPa
centroid 118 Hz
T60 100-500 Hz 2.9 s, 2-8 kHz 23.2 s
wav peak -6.8 dBFS
Open in simulator

Damping: frequency-dependent loss (drumstick strike)

The same sweep excited by the default drumstick strike (30 g at 3 m/s) instead of the corner push. Struck, the difference is more audible: the lowest value gives a long metallic ring with a centroid near 3.8 kHz, and the highest a dull thud with a centroid near 220 Hz.

Playback gain +20 dB relative to 1 Pa = 0 dBFS (the simulator's default is +20 dB); loud onsets are soft-clipped. Spectrograms: 0 to 5 kHz over the clip, 80 dB range, one color scale per section.
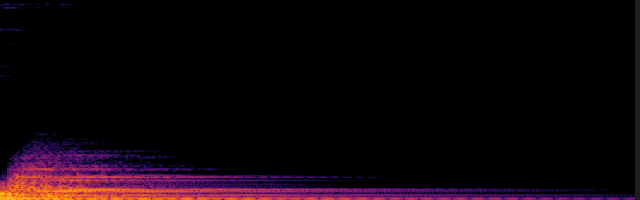
0.0001 m^2/s
spectrogram
peak 2.552 Pa (102 dB SPL)
RMS 13.5 mPa
centroid 3839 Hz
T60 100-500 Hz 5.6 s, 2-8 kHz 2.7 s
contact force 195 N
wav peak 28.1 dBFS (soft-clipped)
Open in simulator
0.0005 m^2/s
spectrogram
peak 2.552 Pa (102 dB SPL)
RMS 10.9 mPa
centroid 655 Hz
T60 100-500 Hz 4.2 s, 2-8 kHz 4.6 s
contact force 195 N
wav peak 28.1 dBFS (soft-clipped)
Open in simulator
0.0025 m^2/s
spectrogram
peak 2.554 Pa (102 dB SPL)
RMS 10.0 mPa
centroid 218 Hz
T60 100-500 Hz 2.8 s, 2-8 kHz 35.6 s
contact force 195 N
wav peak 28.1 dBFS (soft-clipped)
Open in simulator

Damping: in-plane loss (push and release)

The stretching modes of the sheet lie at several kilohertz and, once the sheet is curved, couple to transverse motion. Without their own loss they ring for the whole low-frequency decay. Under the push the effect on the metrics is small (the band above 2 kHz is more than 40 dB down in every case); it is mainly audible as a faint high ring late in the decay when the loss is zero.

Playback gain +20 dB relative to 1 Pa = 0 dBFS (the simulator's default is +20 dB); loud onsets are soft-clipped. Spectrograms: 0 to 5 kHz over the clip, 80 dB range, one color scale per section.
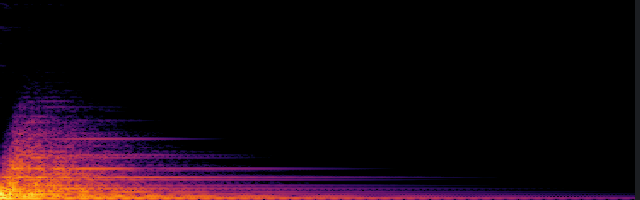
0 1/s
spectrogram
peak 0.047 Pa (67 dB SPL)
RMS 3.4 mPa
centroid 198 Hz
T60 100-500 Hz 4.1 s, 2-8 kHz 14.7 s
wav peak -6.6 dBFS
Open in simulator
20 1/s
spectrogram
peak 0.046 Pa (67 dB SPL)
RMS 3.3 mPa
centroid 196 Hz
T60 100-500 Hz 4.0 s, 2-8 kHz 7.7 s
wav peak -6.7 dBFS
Open in simulator
100 1/s
spectrogram
peak 0.047 Pa (67 dB SPL)
RMS 3.3 mPa
centroid 198 Hz
T60 100-500 Hz 4.1 s, 2-8 kHz 6.0 s
wav peak -6.6 dBFS
Open in simulator

Damping: in-plane loss (drumstick strike)

The same sweep excited by the default drumstick strike (30 g at 3 m/s) instead of the corner push. Struck, the difference is plain: with no in-plane loss the stretching modes ring at several kilohertz and pull the centroid up to about 5 kHz.

Playback gain +20 dB relative to 1 Pa = 0 dBFS (the simulator's default is +20 dB); loud onsets are soft-clipped. Spectrograms: 0 to 5 kHz over the clip, 80 dB range, one color scale per section.
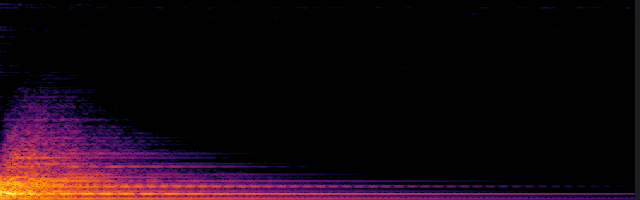
0 1/s
spectrogram
peak 2.552 Pa (102 dB SPL)
RMS 11.3 mPa
centroid 5040 Hz
T60 100-500 Hz 4.3 s, 2-8 kHz 6.0 s
contact force 195 N
wav peak 28.1 dBFS (soft-clipped)
Open in simulator
20 1/s
spectrogram
peak 2.552 Pa (102 dB SPL)
RMS 10.9 mPa
centroid 655 Hz
T60 100-500 Hz 4.2 s, 2-8 kHz 4.6 s
contact force 195 N
wav peak 28.1 dBFS (soft-clipped)
Open in simulator
100 1/s
spectrogram
peak 2.552 Pa (102 dB SPL)
RMS 10.9 mPa
centroid 637 Hz
T60 100-500 Hz 3.7 s, 2-8 kHz 3.9 s
contact force 195 N
wav peak 28.1 dBFS (soft-clipped)
Open in simulator

Generated by steelsim gallery; parameters not listed take the simulator defaults.